Chapter 19
Ionic Equilibria in Aqueous Systems
Copyright ©The McGraw-Hill Companies, Inc. Permission required for reproduction or display.
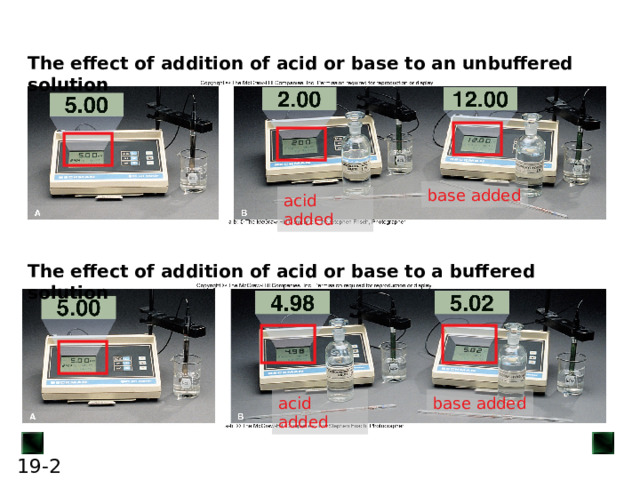
The effect of addition of acid or base to an unbuffered solution
base added
acid added
The effect of addition of acid or base to a buffered solution
acid added
base added
2
![An acid-base buffer is a solution that lessens the impact on pH from the addition of acid or base. Most often, the components of a buffer are the conjugate acid-base pair of a weak acid (or base). Buffers work through a phenomenon known as the common-ion effect . CH 3 COOH( aq ) + H 2 O( l ) H 3 O + ( aq ) + CH 3 COO - ( aq ) If some CH 3 COO - ion is added, the equilibrium position shifts to the left; thus, [H 3 O + ] decreases, lowering the extent of acid dissociation. Similarly, if acetic acid is dissolved in a sodium acetate solution, acetate ion and H 3 O + ion from the acid enter the solution. The acetate ion already present in the solution prevents the acid from dissociating as much as it would in pure water, thus lowering [H 3 O + ]. In this case, acetate ion is called the common ion . The common-ion effect occurs when a given ion is added to an equilibrium mixture that already contains that ion, and the position of the equilibrium shifts away from forming more of it.](http://fsd.intolimp.org/html/2023/10/30/i_653f673333a31/img_phpx7sK07_L-19---bis_2.jpg)
An acid-base buffer is a solution that lessens the impact on pH from the addition of acid or base.
Most often, the components of a buffer are the conjugate acid-base pair of a weak acid (or base).
Buffers work through a phenomenon known as the common-ion effect .
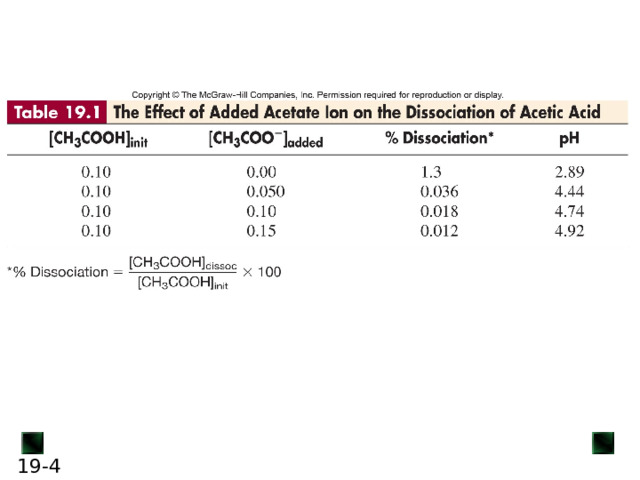
CH 3 COOH( aq ) + H 2 O( l ) H 3 O + ( aq ) + CH 3 COO - ( aq )
If some CH 3 COO - ion is added, the equilibrium position shifts to the left; thus, [H 3 O + ] decreases, lowering the extent of acid dissociation.
Similarly, if acetic acid is dissolved in a sodium acetate solution, acetate ion and H 3 O + ion from the acid enter the solution. The acetate ion already present in the solution prevents the acid from dissociating as much as it would in pure water, thus lowering [H 3 O + ].
In this case, acetate ion is called the common ion .
The common-ion effect occurs when a given ion is added to an equilibrium mixture that already contains that ion, and the position of the equilibrium shifts away from forming more of it.
2
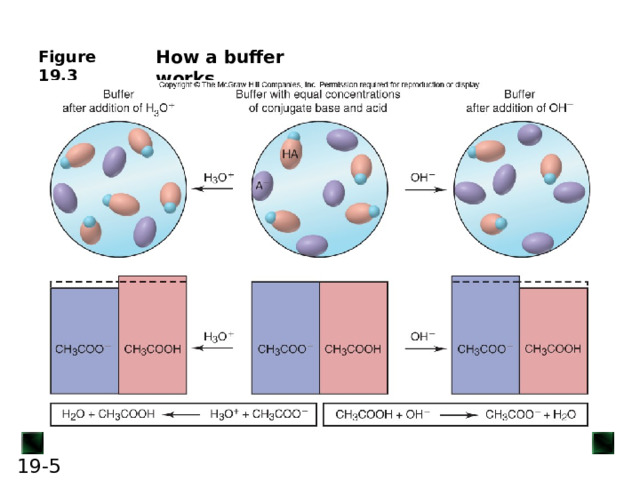
How a buffer works
2
![The Henderson-Hasselbalch Equation 2 3 + - 3 + - K a 3 + K a - - 3 + K a [base] pH = p K a + log [acid] 6](http://fsd.intolimp.org/html/2023/10/30/i_653f673333a31/img_phpx7sK07_L-19---bis_5.jpg)
The Henderson-Hasselbalch Equation
2 3 + -
3 + -
K a
3 + K a
-
-
3 + K a
[base]
pH = p K a + log
[acid]
6
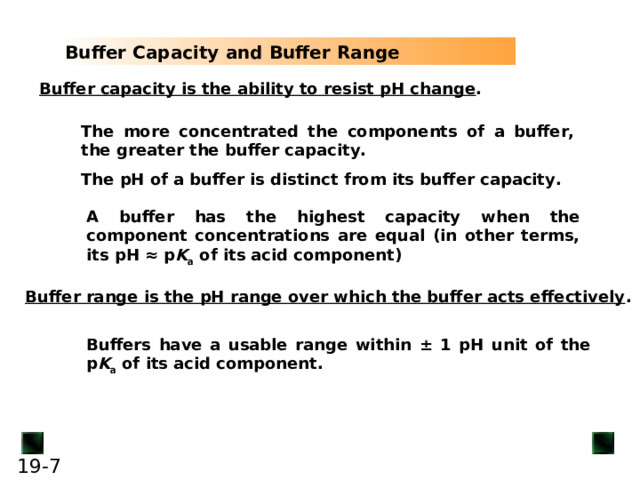
Buffer Capacity and Buffer Range
Buffer capacity is the ability to resist pH change
A buffer has the highest capacity when the component concentrations are equal (in other terms, its pH ≈ p K a of its acid component)
Buffer range is the pH range over which the buffer acts effectively
Buffers have a usable range within ± 1 pH unit of the p K a of its acid component.
6
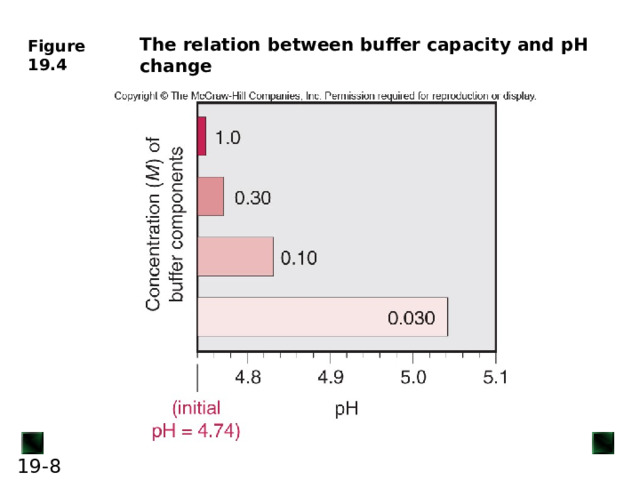
The relation between buffer capacity and pH change
6
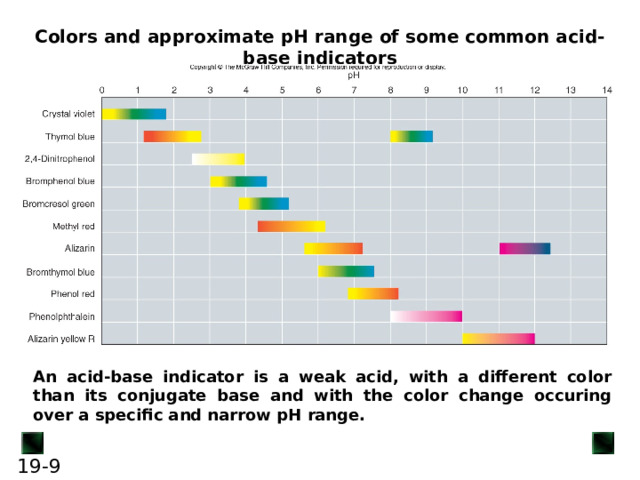
Colors and approximate pH range of some common acid-base indicators
An acid-base indicator is a weak acid, with a different color than its conjugate base and with the color change occuring over a specific and narrow pH range.
6
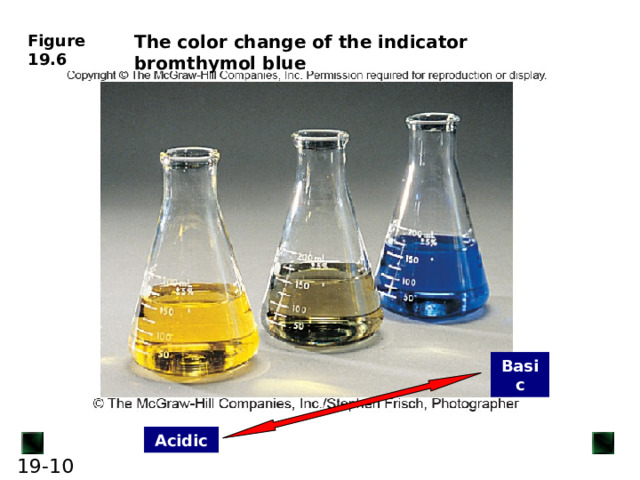
The color change of the indicator bromthymol blue
Basic
Acidic
6
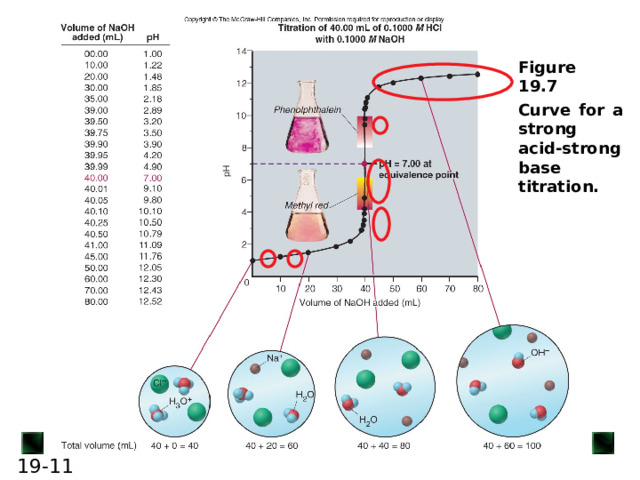
6
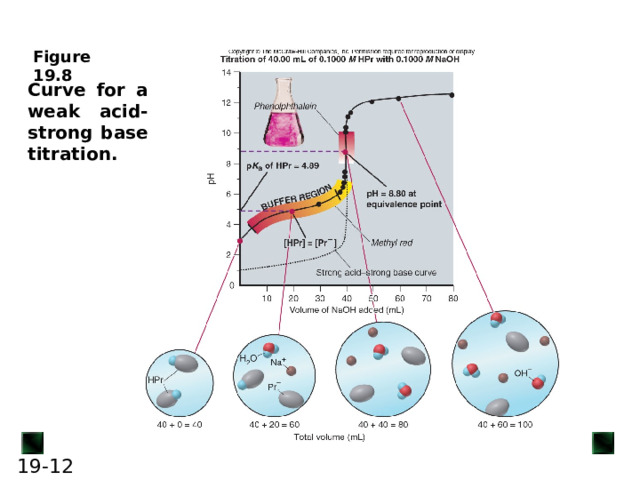
Curve for a weak acid-strong base titration.
6
![Sample Problem 19.4 Calculate the pH during the titration of 40.00 mL of 0.1000 M propanoic acid (HPr; K a = 1.3 x 10 -5 ) after adding the following volumes of 0.1000 M NaOH: (a) 0.00 mL (b) 30.00 mL (c) 40.00 mL (d) 50.00 mL The amounts of HPr and Pr - will be changing during the titration. Remember to adjust the total volume of solution after each addition. Find the starting pH using the methods of Sample Problem 18.8. [Pr - ][H 3 O + ] [Pr - ] = x = [H 3 O + ] K a = [HPr] x = 1.1 x 10 -3 ; pH = 2.96 HPr( aq ) + OH - ( aq ) Pr - ( aq ) + H 2 O ( l ) - 0.004000 0 - Initial 0.003000 - Change - - Final 0 - 0.001000 0.003000 13](http://fsd.intolimp.org/html/2023/10/30/i_653f673333a31/img_phpx7sK07_L-19---bis_12.jpg)
Sample Problem 19.4
Calculate the pH during the titration of 40.00 mL of 0.1000 M propanoic acid (HPr; K a = 1.3 x 10 -5 ) after adding the following volumes of 0.1000 M NaOH:
(a) 0.00 mL
(b) 30.00 mL
(c) 40.00 mL
(d) 50.00 mL
The amounts of HPr and Pr - will be changing during the titration. Remember to adjust the total volume of solution after each addition.
Find the starting pH using the methods of Sample Problem 18.8.
[Pr - ][H 3 O + ]
[Pr - ] = x = [H 3 O + ]
K a =
[HPr]
x = 1.1 x 10 -3 ; pH = 2.96
HPr( aq ) + OH - ( aq ) Pr - ( aq ) + H 2 O ( l )
-
0.004000
0
-
Initial
0.003000
-
Change
-
-
Final
0
-
0.001000
0.003000
13
![Sample Problem 19.4 continued (2 of 3) 0.001000 mol [H 3 O + ] = 1.3 x 10 -5 x = 4.3 x 10 -6 M pH = 5.37 0.003000 mol (c) When 40.00 mL of NaOH are added, all of the HPr will be reacted and the [Pr - ] will be (0.004000 mol) = 0.05000 M (0.004000 L) + (0.004000 L) 1.0 x 10 -14 K w K a x K b = K w K b = = = 7.7 x 10 -10 1.3 x 10 -5 K a K w [H 3 O + ] = = 1.6 x 10 -9 M pH = 8.80 14](http://fsd.intolimp.org/html/2023/10/30/i_653f673333a31/img_phpx7sK07_L-19---bis_13.jpg)
Sample Problem 19.4
continued (2 of 3)
0.001000 mol
[H 3 O + ] = 1.3 x 10 -5 x
= 4.3 x 10 -6 M
pH = 5.37
0.003000 mol
(c) When 40.00 mL of NaOH are added, all of the HPr will be reacted and the [Pr - ] will be
(0.004000 mol)
= 0.05000 M
(0.004000 L) + (0.004000 L)
1.0 x 10 -14
K w
K a x K b = K w
K b = = = 7.7 x 10 -10
1.3 x 10 -5
K a
K w
[H 3 O + ] = = 1.6 x 10 -9 M
pH = 8.80
14
![Sample Problem 19.4 continued (3 of 3) (d) 50.00 mL of NaOH will produce an excess of OH - . mol excess base = (0.1000 M )(0.05000 L - 0.04000 L) = 0.00100 mol 1.0 x 10 -14 M = (0.00100 mol) M = 0.01111 [H 3 O + ] = = 9.0 x 10 -13 M (0.0900 L) 0.01111 pH = 12.05 15](http://fsd.intolimp.org/html/2023/10/30/i_653f673333a31/img_phpx7sK07_L-19---bis_14.jpg)
Sample Problem 19.4
continued (3 of 3)
(d) 50.00 mL of NaOH will produce an excess of OH - .
mol excess base = (0.1000 M )(0.05000 L - 0.04000 L) = 0.00100 mol
1.0 x 10 -14
M = (0.00100 mol)
M = 0.01111
[H 3 O + ] = = 9.0 x 10 -13 M
(0.0900 L)
0.01111
pH = 12.05
15
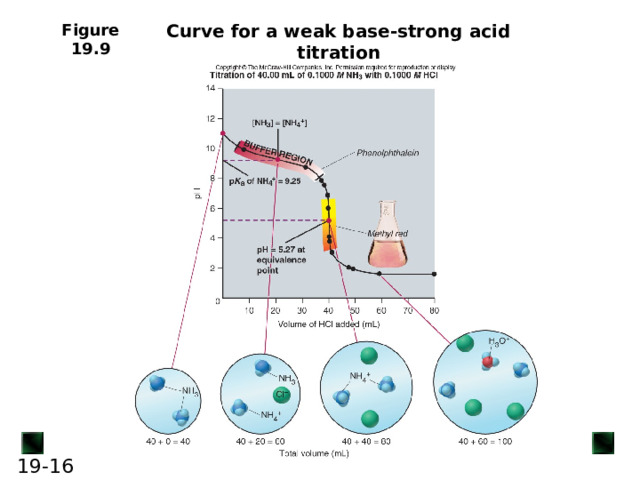
Curve for a weak base-strong acid titration
15
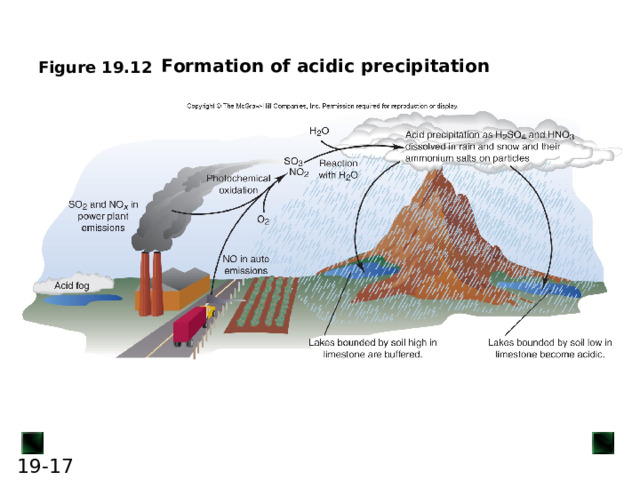
Formation of acidic precipitation
15


